
Core Concept
Why Variation Exists in Every Process
Recognizing inevitable systemic noise versus actionable process disturbances before taking corrective action.
Explore control charts, time-ordered measurements, process stability, and special-cause questions through independent statistical examples. VariationSignal Atlas helps readers distinguish ordinary fluctuation from meaningful process signals.

Our statistical frameworks differentiate common-cause noise from actionable special-cause signals, delivering quantifiable stability improvements across diverse operations.
Explore Stability Methodology
In industrial operations and organizational systems, the costliest mistakes rarely stem from lack of vigilance. They stem from misinterpreting routine fluctuation as an emergent disaster, or dismissing a genuine structural shift as random noise.
A control chart is never universal proof of product quality. It does not dictate whether output meets consumer expectations; it serves as a rigorous communication channel revealing what the underlying system is truly doing over time. We created this atlas to provide engineers, analysts, and leadership teams with an uncompromising reference for reading chronological stability before acting on intuition.
A reproducible dataset examining package weights across three operational shifts to distinguish normal process variation from actionable signals.
Target net weight: 500.0g. Samples collected in time-ordered subgroups of 5 items across Shifts 1, 2, and 3.
Subgroup size n=5. Ideal for evaluating both within-shift consistency and shift-to-shift mean displacement.
Rule 1 violation detected on Shift 2 due to an uncalibrated volumetric feeder adjustment during operator handover.
Subgroup samples (n=5) by shift sequence
| Subgroup | Shift | Time | Mean (g) | Range (g) | Status |
|---|---|---|---|---|---|
| #01 | Shift 1 | 06:30 | 500.2 | 1.4 | In Control |
| #02 | Shift 1 | 08:00 | 499.8 | 1.8 | In Control |
| #03 | Shift 1 | 09:30 | 500.5 | 1.2 | In Control |
| #04 | Shift 1 | 11:00 | 500.1 | 1.5 | In Control |
| #05 | Shift 2 | 14:30 | 502.8 | 1.6 | Signal (Rule 1) |
| #06 | Shift 2 | 16:00 | 503.1 | 2.1 | Signal (Rule 1) |
| #07 | Shift 2 | 17:30 | 502.4 | 1.9 | Run Signal |
| #08 | Shift 3 | 22:30 | 499.9 | 1.3 | In Control |
| #09 | Shift 3 | 00:00 | 500.3 | 1.7 | In Control |
| #10 | Shift 3 | 01:30 | 500.0 | 1.1 | In Control |
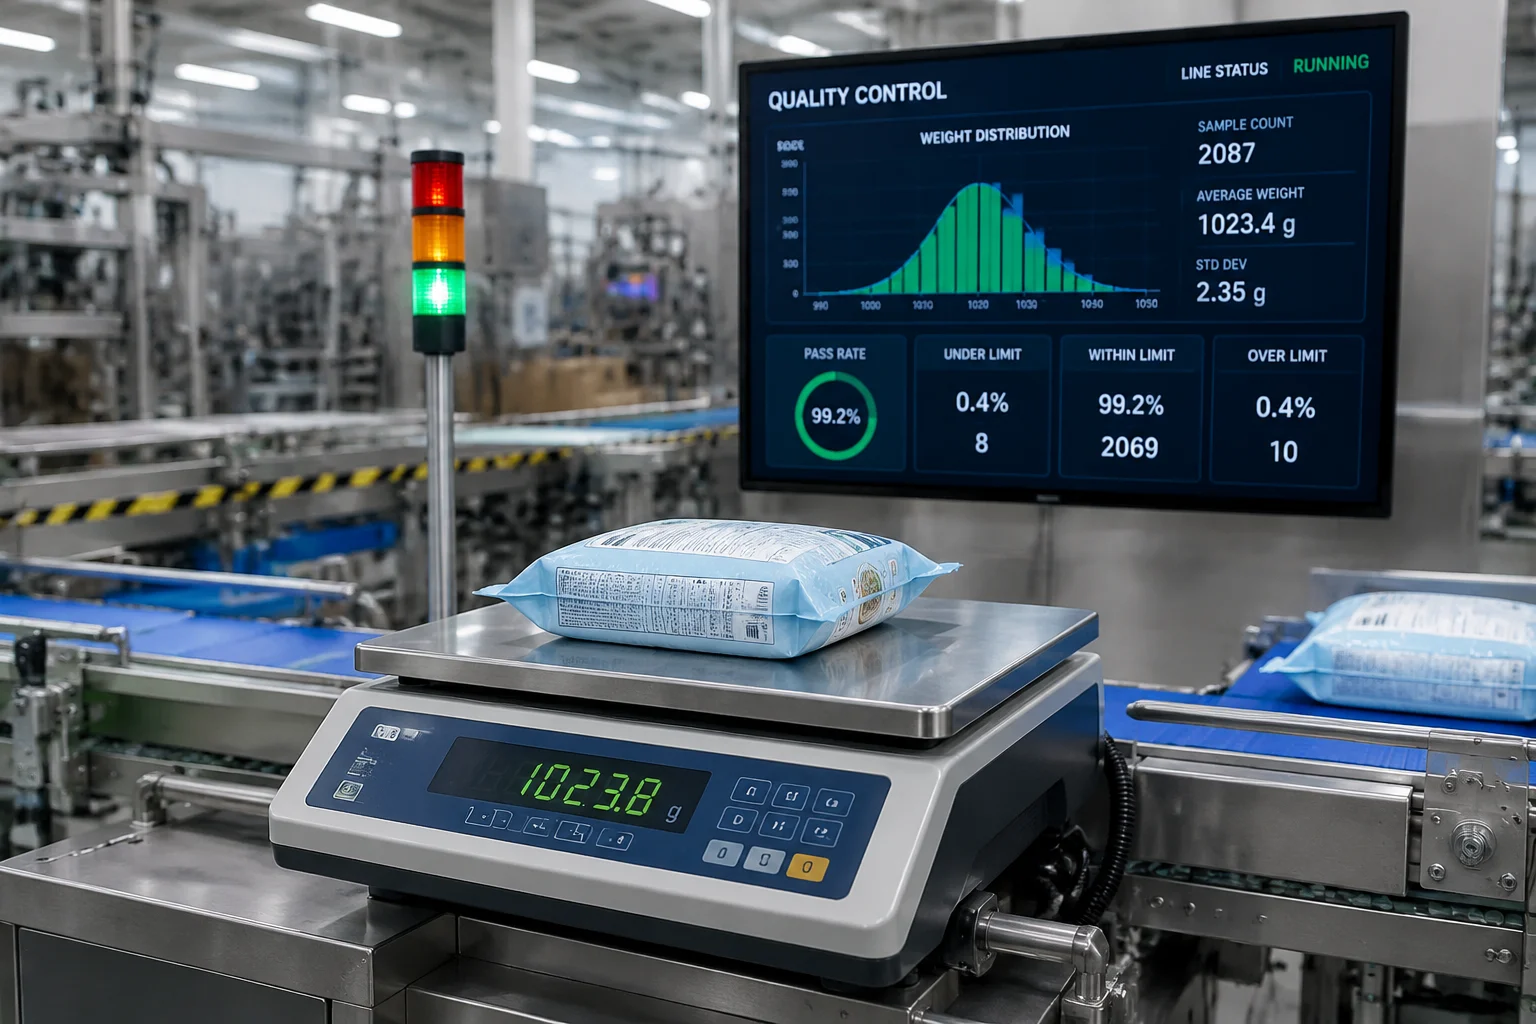
Data is collected in rational subgroups of 5 consecutive packages sampled at fixed intervals. Subgrouping captures natural short-term noise inside the group while the Xbar chart monitors average shifts between shifts.
While Shifts 1 and 3 reflect stable background noise around 500.0g, Shift 2 exhibits an average jump to 502.8g. This exceeds the Upper Control Limit (UCL = 502.1g), marking a special-cause event rather than inherent process variation.
Log investigation confirmed a raw material bulk density change combined with an unverified manual tare override during the Shift 2 shift change.
A company measures the weight of packages over several shifts.
| Dataset element | Illustrative assumption |
|---|---|
| Measurement | Package weight |
| Observation period | Several shifts |
| Collection method | Time-ordered samples |
| Review question | Is variation stable? |
| Intended output | Annotated chart and review notes |
Developers should prepare a reproducible training dataset, explain the rationale for the chart selection, and provide an interpretation example.
If the chart depicts an unstable signal, it should truly correspond to the generated data and the rules of the selected chart.
A sequence of rational subgroup measurements reveals non-random movement on a Shewhart individual value chart. We examine the empirical criteria for initiating a process investigation while maintaining the critical distinction between statistical stability and dimensional product conformance.
Is Subgroup #12 sufficient statistical justification to halt production and initiate a root-cause search?
Vital Conformance Principle: A control chart measures process predictability, not engineering acceptance. These components remain fully within standard engineering specification tolerances (24.00 – 36.00 mm). The presence of a special cause makes no definitive claim of part defectiveness.
Every statistical control chart at VariationSignal Atlas is compiled and reviewed by real quality engineers and statistical analysts, turning raw time-ordered metrics into clear process signals.

We organize process readings chronologically into rational subgroups to capture variation between batches while minimizing noise within sub-samples.
Control limits are computed purely from the natural voice of the process (3-sigma bounds), deliberately separated from customer tolerance specifications.
Our specialists review shift notes, equipment maintenance logs, and environmental changes before classifying any data point as a true special-cause signal.
Findings are published in concise, peer-reviewed atlas articles to provide manufacturing teams and quality leads with clear actionable guidance.
Recognizing inevitable systemic noise versus actionable process disturbances before taking corrective action.

Understanding why customer tolerances and statistical process behavior tell entirely different operational stories.

How routine operational fluctuations behave over time and why reacting prematurely introduces artificial noise.

Clear guidelines for identifying statistically significant shifts, trends, and non-random chart patterns.
Explore real-world case studies evaluating manufacturing process variation, distinguishing routine noise from statistically significant operational signals.

Detailed statistical analysis of cycle time fluctuations across automated assembly stations to separate inherent variance from operational delays.

Investigation into non-conformity rate spikes using p-charts, evaluating whether defect clusters stem from common causes or special signals.

Continuous temperature metric evaluation across heat-treatment phases to verify control limit boundary compliance and sensor stability.