Minitab Control Charts: An Independent Interpretation Guide
Explore how control charts in Minitab Statistical Software help readers examine process variation, stability, and statistical signals.
An independent educational guide to choosing and interpreting process-control charts.
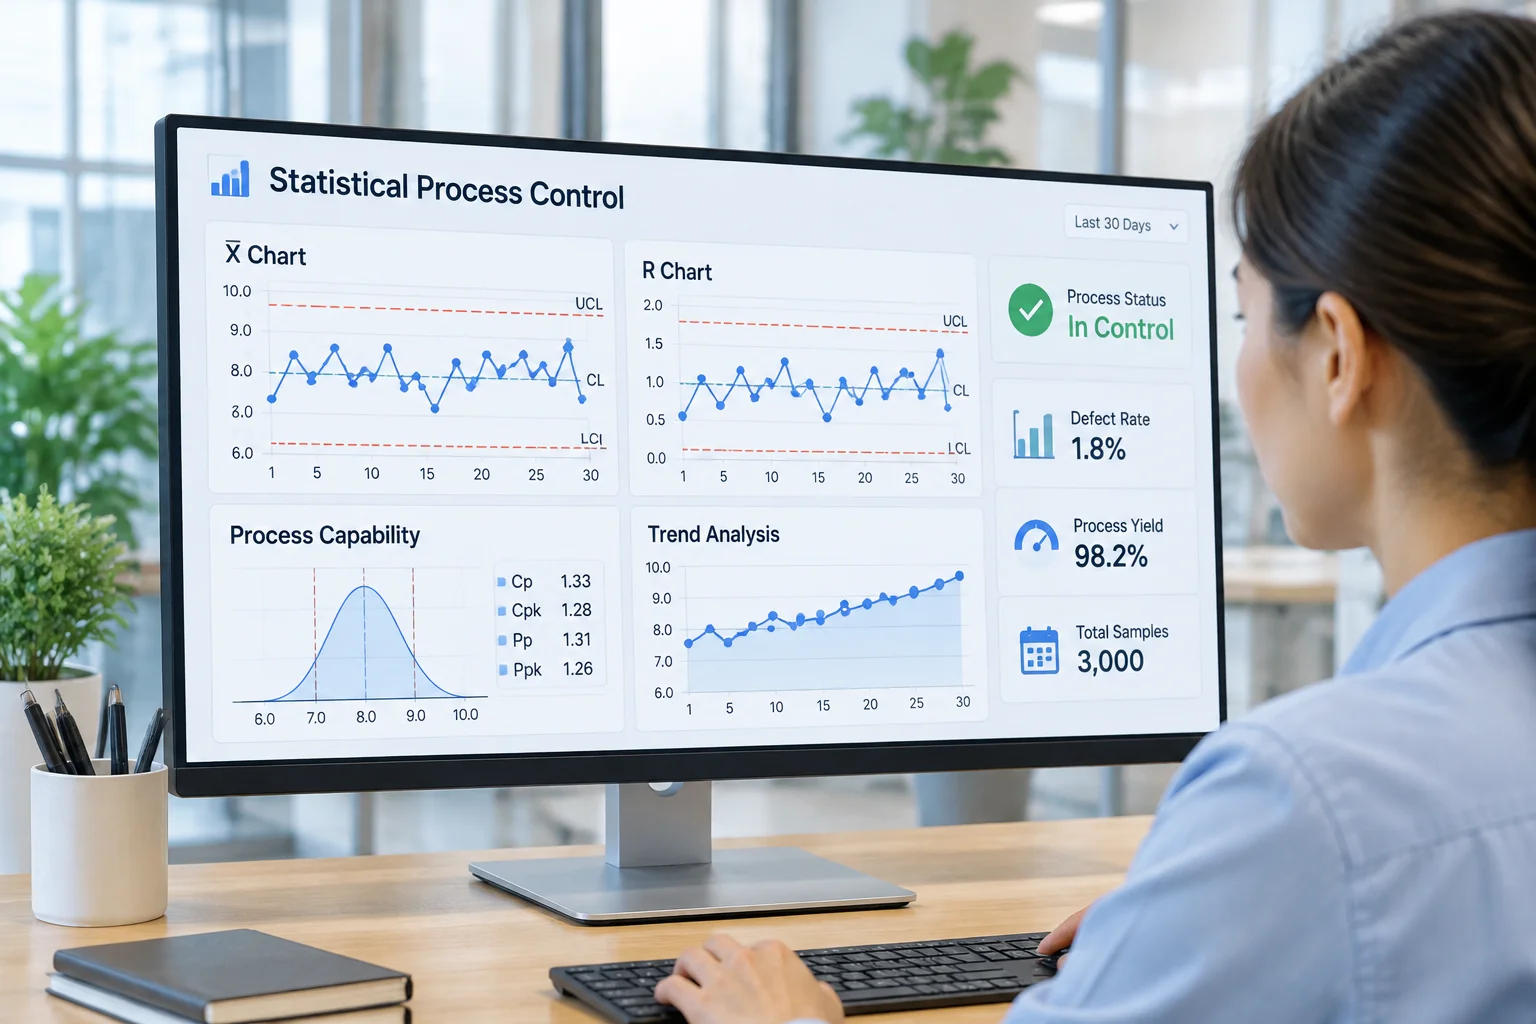
Minitab Control Chart Interpretation Modules
Navigate essential statistical process control concepts, chart selection metrics, and interpretation principles for Minitab output analysis.
Control Chart Purpose
Control charts distinguish natural common-cause variation from assignable special-cause signals. They establish a baseline of process predictability over time.
Time-Ordered Data Principles
Data must be gathered sequentially in strict chronological order. Altering timestamps or sorting data points distorts run-length patterns and invalidates signal tests.
I-MR vs Subgroup Charts
Use Individuals & Moving Range (I-MR) charts for continuous single measurements. Choose Xbar-R or Xbar-S when rational subgroups (n ≥ 2) capture within-sample variation.
Control Limits Calculation
Control limits (UCL and LCL) represent statistical boundaries set at ±3 standard deviations (±3σ) from the process centerline based on empirical data variance.
Special-Cause Test Rules
Minitab evaluates 8 standard Nelson tests: points beyond 3σ, 9 consecutive points on one side of center, 6 points continuously increasing or decreasing, and systematic oscillation.
Critical Chart Assumptions
Valid interpretation requires independent observations without autocorrelation. While I-MR charts expect approximate normality, subgroup average charts rely on the Central Limit Theorem.
Control vs Specification Limits
Control limits reflect process voice and empirical capability. Specification limits are customer requirements. Never plot specification limits directly on an Xbar chart.
Example Interpretation
Work through a plotted sequence: verify the dispersion chart first, check points against control limits, then decide whether a flagged subgroup justifies a structured process investigation.
Limitations of Conclusions
Statistical control confirms process consistency, not product acceptability. A stable process can consistently produce out-of-spec items if baseline variability is excessive.
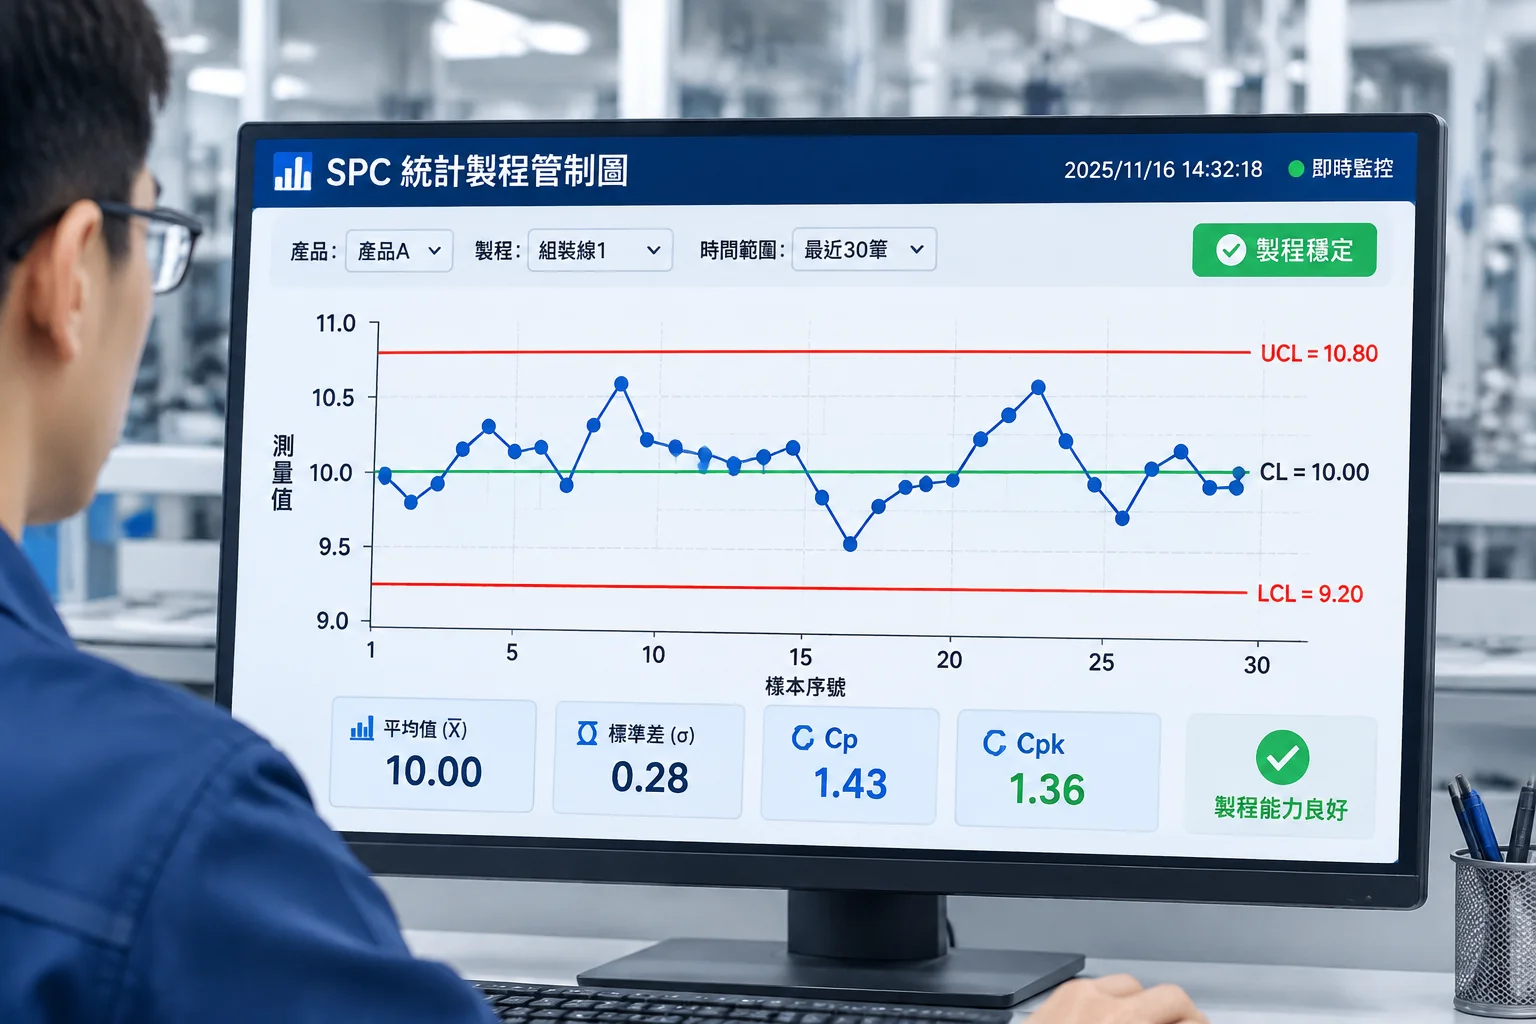
Real-Time Test 1 Signal
Point 14 exceeded UCL at 3.42σ limit threshold
Step-by-Step Minitab Signal Interpretation
When Minitab flags red data points, structured diagnosis prevents premature parameter adjustments. Follow this standardized signal verification methodology:
Verify Subgroup Measurement Integrity
Confirm that measurement tools, gauge calibration, and data entry timestamps contain no clerical errors.
Cross-Examine Range / StDev Chart
Always inspect the lower dispersion chart (R or S) first. Unstable within-subgroup variation invalidates Xbar limits.
Isolate Assignable Causes
Correlate out-of-control occurrences with shift changes, raw material batches, tooling wear, or environmental shifts.
One Unusual Subgroup
A hypothetical set of time-ordered measurements is plotted on an Xbar-style control chart. One subgroup mean falls beyond the upper control limit. Is that signal enough to investigate the process?
Hypothetical Subgroup Measurements
| Subgroup | Mean | Reading |
|---|---|---|
| #01 | 99.8 | Within limits |
| #02 | 100.4 | Within limits |
| #03 | 99.5 | Within limits |
| #04 | 100.9 | Within limits |
| #05 | 99.9 | Within limits |
| #06 | 100.6 | Within limits |
| #07 | 99.7 | Within limits |
| #08 | 100.3 | Within limits |
| #09 | 106.2 | Beyond UCL |
| #10 | 100.1 | Within limits |
| #11 | 99.6 | Within limits |
| #12 | 100.2 | Within limits |
Center line 100.0, UCL 103.0, LCL 97.0 — limits computed from the same illustrative dataset.
Plotted Control Chart
Is the signal enough to investigate the process?
A single point beyond the upper control limit is a reason to open a structured review — check the measurement record, confirm the subgroup was rational, and look for an assignable cause in process logs.
One chart alone cannot support claims about product defectiveness, compliance with external standards, or the technological cause of the event. Those conclusions require evidence beyond the plotted signal.
Independent Publication — No Vendor Affiliation
Minitab Statistical Software is a third-party statistical analysis application. VariationSignal Atlas is an independent educational publication. It does not sell Minitab licenses, distribute software, provide official training certifications, or guarantee statistical conclusions.
Need Expert Technical Assistance with Minitab Models?
Connect with our statistical control specialists to evaluate complex multi-variate signals, autocorrelation issues, or custom baseline setup.